Get started
Interface tour
The five areas of the screen and what each tab controls.
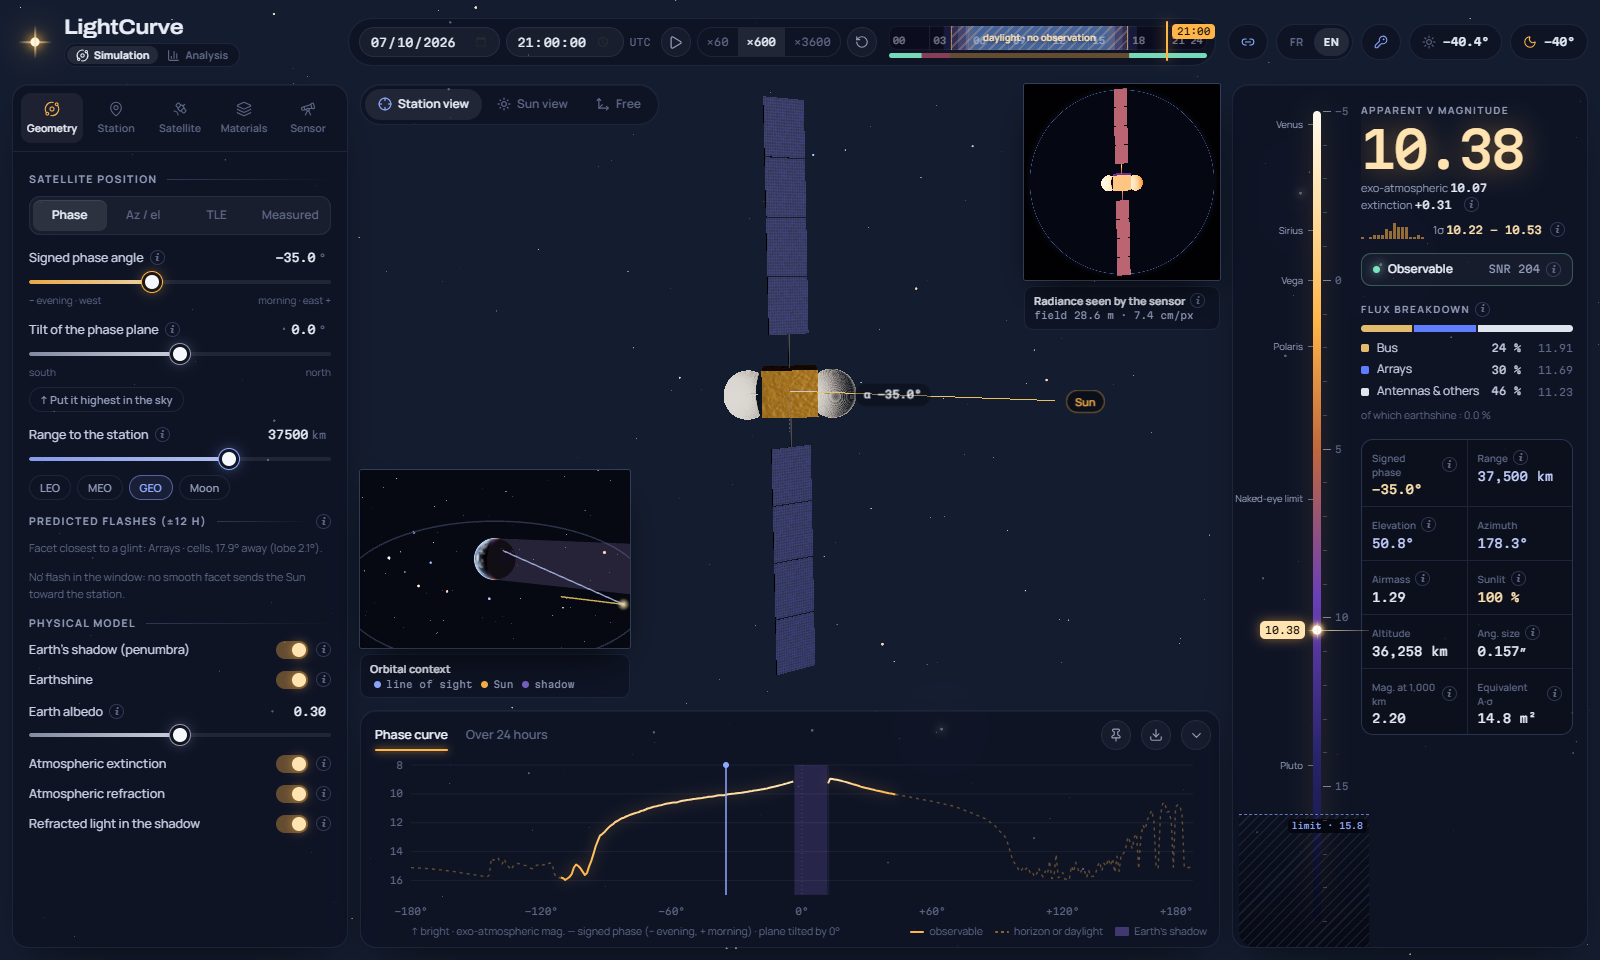
The five areas
Section titled “The five areas”| Area | Where | What it does |
|---|---|---|
| Top bar | Top | Simulation / Analysis switch under the name (Analysis workspace, Operations plan), UTC date and time, time-lapse (×60, ×600, ×3600; space bar), 24-hour timeline, link to the configuration, language (FR / EN), licence, Sun and Moon |
| Control panel | Left | Five tabs that define the scene: Geometry, Station, Satellite, Materials, Sensor |
| 3D view | Centre | The object lit by the Sun, seen from the station, from the Sun, or freely; the image seen by the sensor; the orbital context |
| Curves | Bottom | Phase curve, 24-hour curve, rotation, measurement — click to move the simulation, pin a reference curve, export |
| Results | Right | Magnitude, uncertainty, verdict and SNR, flux breakdown, geometry readouts, magnitude scale |
The timeline
Section titled “The timeline”The 24-hour strip shows the colour of the sky at the station. Periods when the station is in daylight are hatched. The thin band below gives the state at each instant: green observable, violet in the Earth’s shadow, pink too low. Drag it to move in time.
The control panel tabs
Section titled “The control panel tabs”Geometry
How the line of sight is set: signed phase angle and range, azimuth and elevation, a real orbit (TLE or CCSDS OEM), or a loaded measurement. Also the physical model switches (Earth’s shadow, earthshine, extinction, refraction) and the flash prediction. See Geometry modes.
Station
A ground site (built-in sites or coordinates), its extinction and night sky — or an observer in orbit defined by a TLE. See Observer and Atmosphere and sky.
Satellite
The model (catalogue, DISCOS shape, imported CAD), the attitude law, the rotation, plus the validation and synthetic-dataset tools. See Models.
Materials
Albedo, specular reflectance and roughness of each material family, measured BRDF tables, and the Monte-Carlo uncertainty settings. See Materials.
Sensor
Predefined telescope and camera systems, binning, exposure, seeing, saturation, observing constraints and sky background. See Sensor.
Help bubbles
Section titled “Help bubbles”Every important parameter has a help bubble (ⓘ). Hover it, focus it with the keyboard, or tap it on a touch screen.