Analysis module
Analysis module
Months of photometric tracks of one or many objects, read as a report of linked charts.
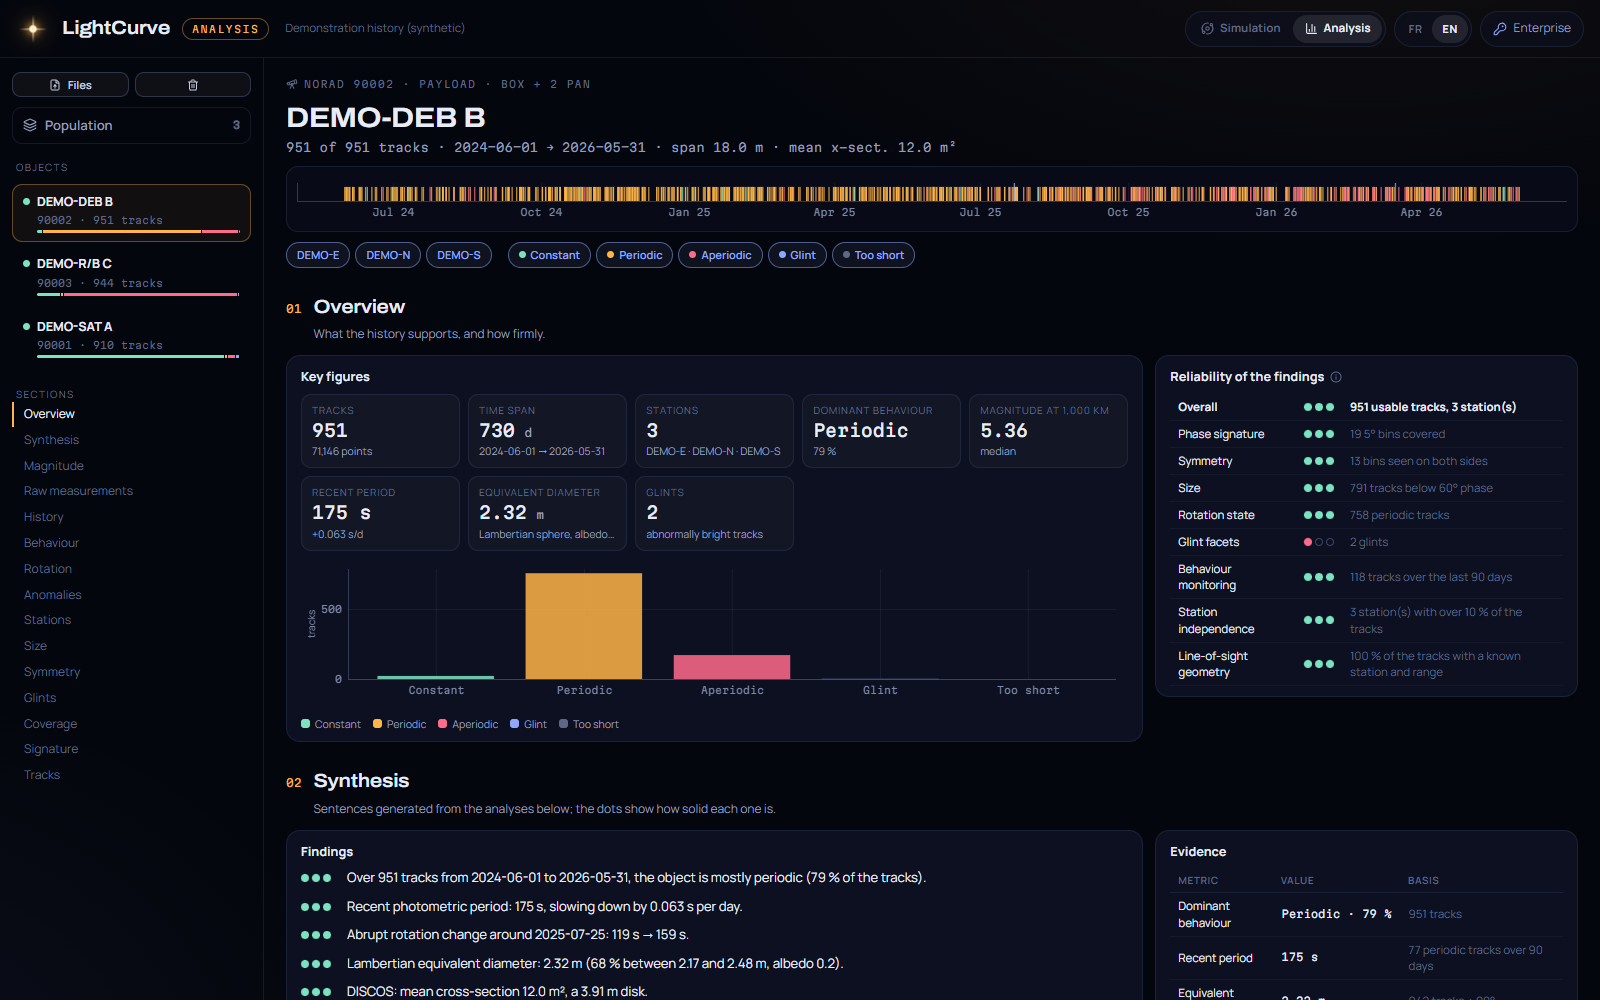
The Analysis workspace turns a photometric history (hundreds or thousands of tracks of one or several objects, from one or several stations) into a report: brightness against phase and time, behaviour classes, rotation and its changes, glints, angular coverage, size, symmetry, anomalies, and a comparison between objects.
Open it
Section titled “Open it”Use the Simulation | Analysis switch under the LightCurve name, in the top bar. The simulator stays as it was and pauses while Analysis is shown; the switch brings it back.
Without data, the page offers two choices:
- Choose files, or drop them anywhere on the page;
- Open the demonstration history: three synthetic geostationary objects watched by three fictitious stations for two years (a stabilized satellite with array glints and a 12-day attitude upset, a tumbling defunct satellite slowing down with an abrupt change, an irregular rocket body). The measurements carry the errors of real ground photometry: noise growing with magnitude and airmass, a zero point per track, an offset per station, outliers (thin clouds, a star in the aperture) and lost frames.
Several files can be loaded together, in any order; their kind is recognised from their columns.
| File | Columns | Needed |
|---|---|---|
| Measurements | norad, object, station_id, obs_id, date, magnitude, phase_angle, distance, and azimuth + true_elevation or ra + dec (measurement CSV), or CCSDS TDM files |
Yes, one file per object or all together |
| Stations | id, name, site, type, latitude, longitude, altitude (m) |
No: without it, a station is placed from its angles when they allow it |
| DISCOS metadata | DISCOS export with shape, cross-sections, objectClass (DISCOS export) |
No: used to compare and predict |
A track is one pass of one object seen by one station: the measurements sharing object, station and observation id, split where they are more than 3 hours apart.
Without a phase angle in the file (a TDM, or a CSV without phase_angle), it is computed from the geometry when the station position and the range are known.
The files are read in the browser, by a background worker. Nothing is sent anywhere, and nothing is kept once the page is closed.
Layout
Section titled “Layout”| Area | Content |
|---|---|
| Left column | Files, the Population view, the list of objects (status dot, track count, bar of behaviour shares), and the sections of the current object |
| Object header | Name, NORAD number, DISCOS class and shape, then the track calendar: one tick per track, coloured by behaviour, with abnormal episodes shaded |
| Filters | Stations and behaviour classes to keep; drag on the calendar to keep a period; Show all resets |
| Report | 15 sections of charts, all computed from the filtered tracks |
| Track panel | Opens on the right when a track is clicked, in any chart or in the track list |
Hovering a point shows its track; a click opens it. Every chart follows the filters.
Population view
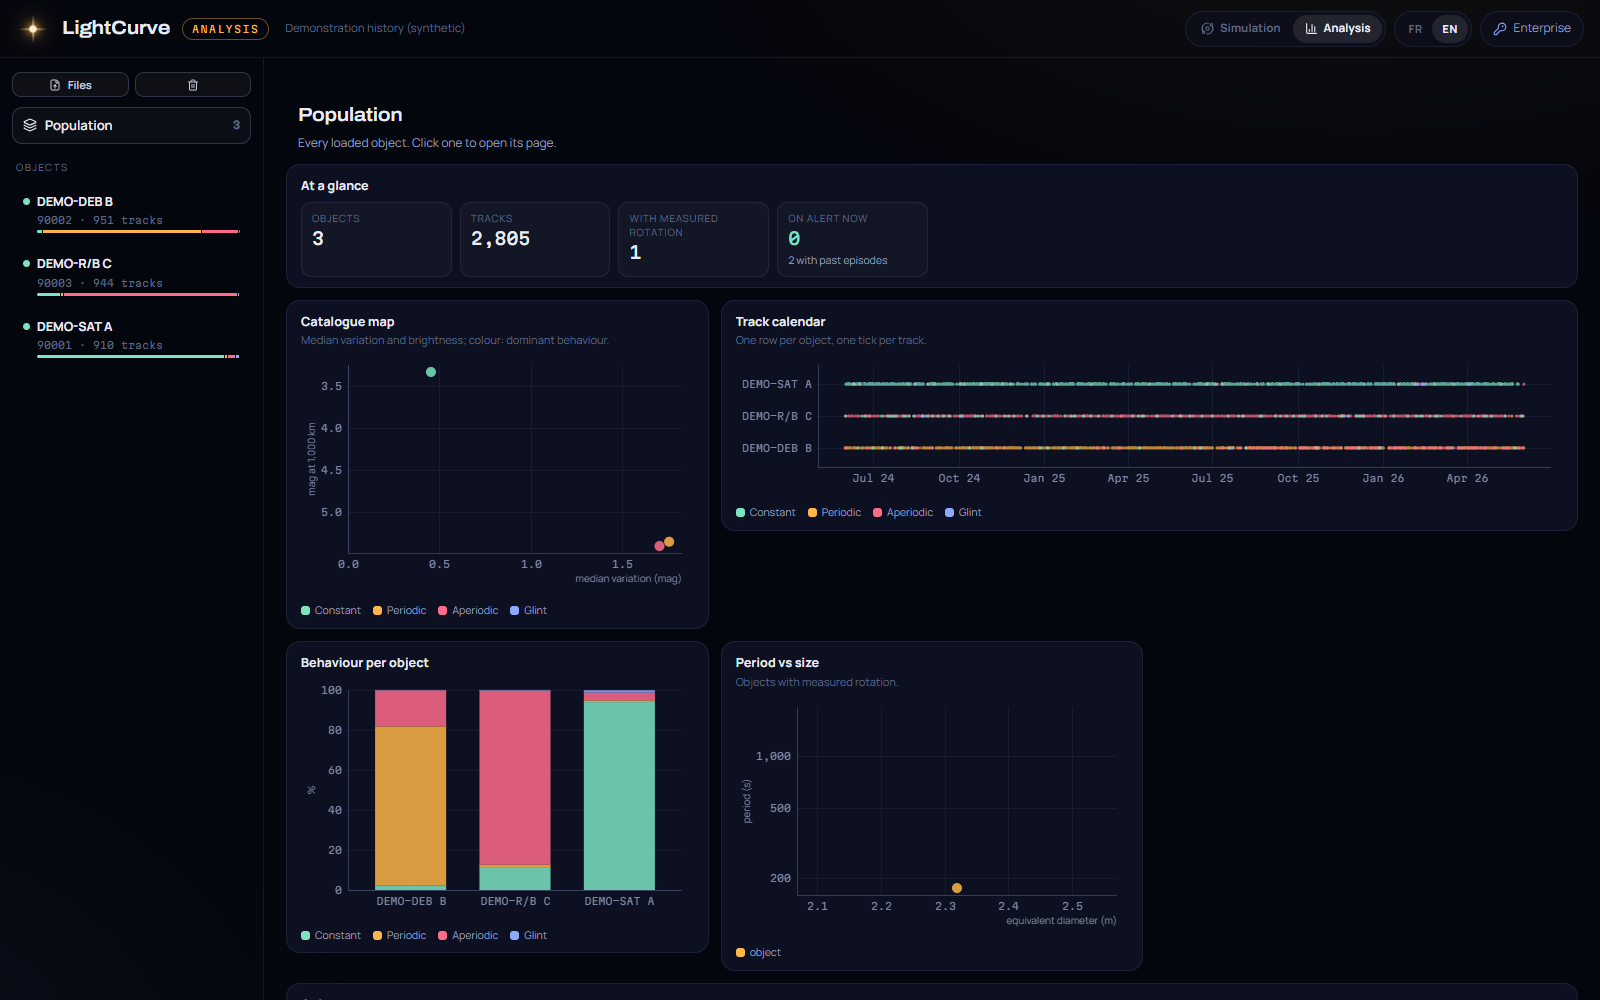
Section titled “Population view”When several objects are loaded, the Population view compares them: tracks, last pass, dominant behaviour, magnitude at 1,000 km, variation, current period, equivalent diameter, glints and monitoring status, plus a catalogue map, a track calendar per object, the behaviour shares and period against size.
A track, in detail
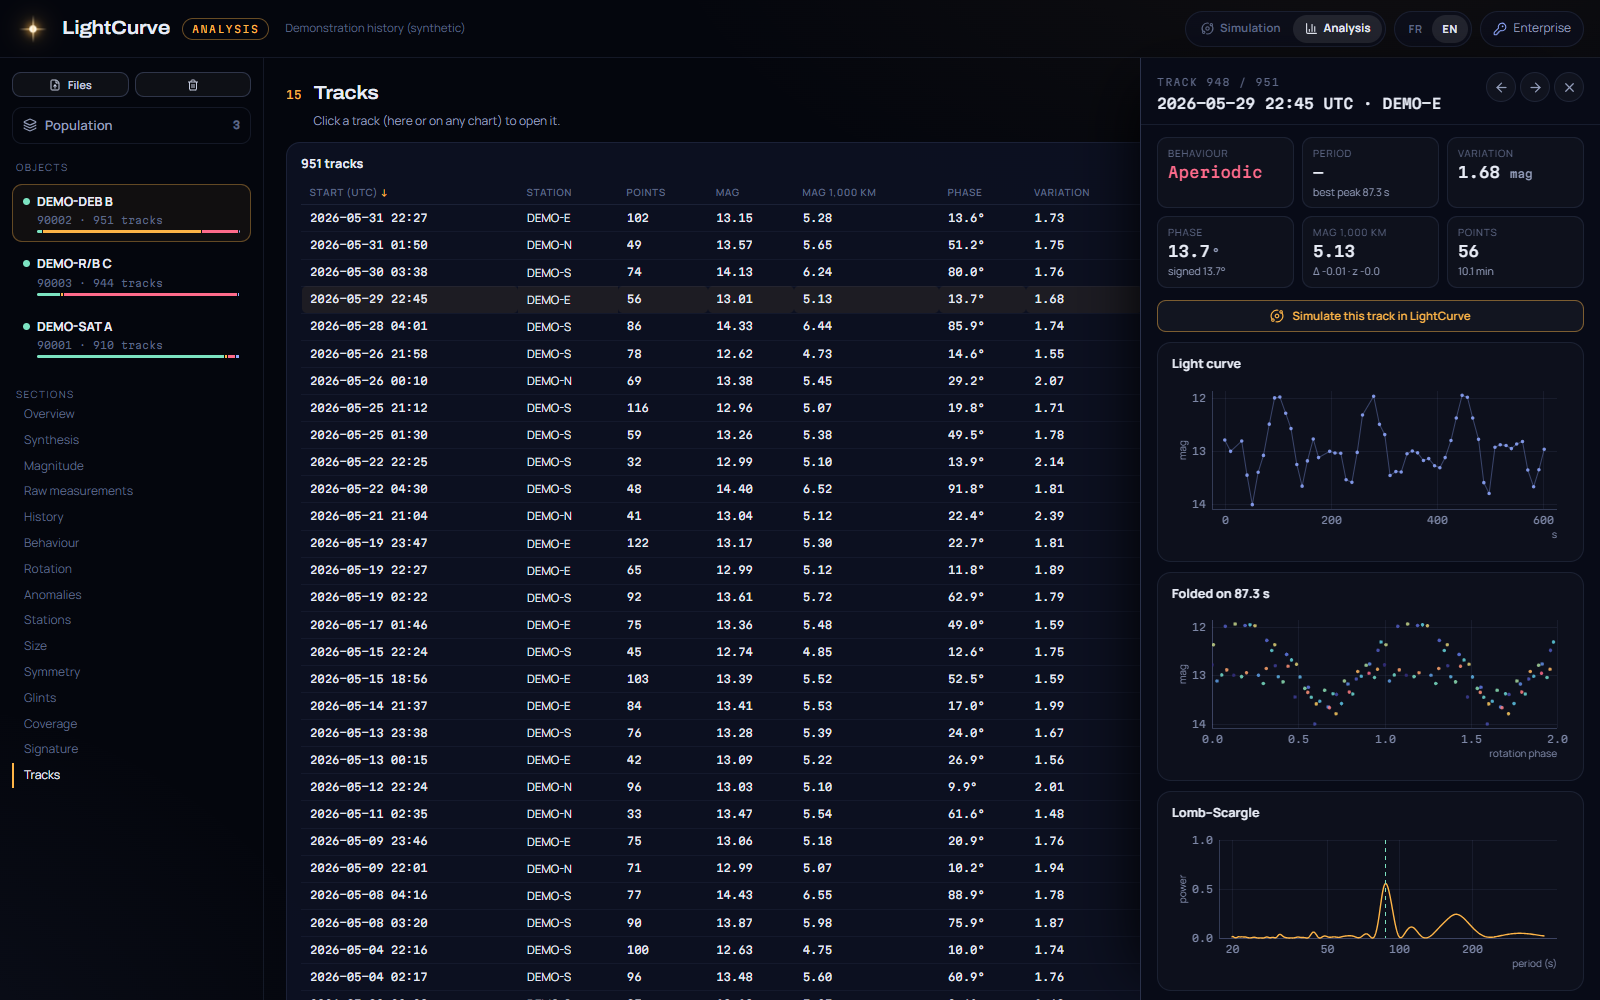
Section titled “A track, in detail”The track panel gives the light curve, the curve folded on its period, the Lomb–Scargle periodogram, the phase dispersion (PDM), the autocorrelation and the magnitude against phase within the pass.
Simulate this track in LightCurve loads the pass in the simulator: measured line of sight, station position, date. The simulator then compares its model with these measurements as with any loaded measurement.
Preview on the other plans
Section titled “Preview on the other plans”The Trial, Academic and Simulations plans open a preview of the workspace from the same switch, marked preview. It holds no analysis method: the server keeps that code for the Operations plan.
- Demonstration: the full report on the synthetic history described above, read-only. Its analyses were computed beforehand and travel as results; the filters and the link to the simulator are left out.
- Your data: drop your own measurement files (CSV or CCSDS TDM, with stations and a DISCOS export if you have them) for a diagnostic. LightCurve takes stock of them — tracks, measurements, objects, stations, follow-up time, phase coverage, evening and morning tracks, geometry — and tells, analysis by analysis, whether these data allow it, in part or not yet, and what would help (a stations file, the range, a longer history). No analysis result is computed. Try the sample runs it on the demonstration history.
As in the workspace itself, the files are read in the browser: nothing is sent, nothing is kept.